TickScope

TickScope — Tick-level & Memory Profiler for RimWorld Features Call-level tick profiling.
TickScope — Tick-level & Memory Profiler for RimWorld
Features
- Call-level tick profiling. TickScope attributes per-tick time to ~20 curated game systems (tick loop, thing ticking, world ticking, job system, rooms/regions, temperature, drawing, and more) with near-zero overhead (~40ns per call, DPA-style aggregation — no micro-patching of hundreds of methods).
- Recursive drill-down. Select any factor (multi-select supported) and expand it up to 3 levels deep — sub-calls are discovered by scanning IL and patched automatically (e.g. ThingTicking → Thing.DoTick → ThingOwner.DoTick / Gen.IsHashIntervalTick).
- Caller attribution. Optional probabilistic stack sampling tells you who is calling a hot method — find the exact mod or system responsible for a hotspot (e.g. a background task hammering temperature queries).
- Custom factors. Add any method by FullTypeName.MethodName and track it alongside the built-ins.
- Memory diagnostics.
- Continuous sampling of commit / working set / Mono heap / Unity allocations → memory_*.csv
- One-click memory census: textures (readable CPU copies vs GPU), world pawns, Defs, maps, meshes/materials/render textures, Mono heap
- Native memory panorama via VirtualQueryEx — private committed block histogram (see what those 16–64 MB blocks really are)
- Stutter monitor — records stalls over 0.25 s with tick and GC context (stutter_*.csv)
- Experimental readable-texture compression (off by default, use with caution)
How to use • Open the TickScope window (bottom-right button next to the play-settings toggles, or Dev menu → Mods → TickScope). • Press Start analysis — it runs for the configured number of ticks and auto-stops. • Check the log for the generated CSV paths, or use Memory census / Native memory panorama buttons for memory data.
Requirements & compatibility
- RimWorld 1.6; Harmony is required (auto-loaded as a dependency).
- Designed as a measurement tool — it does not modify any game logic. Disable it when not profiling for maximum performance.
- Export folder: save folder/RimAnalyzer/
TickScope — RimWorld 调用级 tick 计时与内存测定工具
功能
- 调用级 tick 分项计时。 按因子统计真实时间内各游戏系统的耗时(tick 循环、物休 tick、世界 tick、工作系统、房间/区域、温度、绘制等约 20 个聚合系统),采用 DPA 式聚合计时(每次调用约 40ns,不微 patch 数百个方法),近乎零开销。
- 递归下钻。 可多选任意因子,展开最多 3 层——子调用通过扫描 IL 自动发现并自动挂载(如 ThingTicking → Thing.DoTick → ThingOwner.DoTick / Gen.IsHashIntervalTick)。
- 调用方归因。 可选的概率性调用栈采样,直接告诉你是谁在调热点方法——揪出具体某个 mod / 系统(例如后台任务疯狂刷温度查询)。
- 自定义因子。 按 完整类型名.方法名 添加任意方法,与内置因子一起跟踪。
- 内存诊断。
- 持续采样 提交 / 工作集 / Mono 堆 / Unity 分配 → memory_*.csv
- 一键内存盘点:纹理(可读 CPU 副本 vs GPU)、世界 pawn、Def、地图、Mesh/Material/RenderTexture、Mono 堆
- 原生内存全景(VirtualQueryEx)——私有提交块直方图(看清那些 16–64MB 块到底是什么)
- 卡顿监测——记录超过 0.25s 的停顿及其 tick 与 GC 上下文(stutter_*.csv)
- 实验性可读纹理压缩(默认关闭,谨慎使用)
使用方法 • 打开 TickScope 窗口(右下角播放设置行的按钮,或 Dev 菜单 → Mods → TickScope)。 • 点开始分析——按设定 tick 数运行后自动停止。 • 查看日志中的 CSV 路径;内存数据用内存盘点 / 原生内存全景按钮。
依赖与兼容
- RimWorld 1.6,需要 Harmony(作为依赖自动加载)。
- 纯测量工具,不修改任何游戏逻辑;不分析时建议关闭以获得最佳性能。
- 导出目录:存档目录/RimAnalyzer/
Similar Mods


Vanilla Furniture Expanded - Spacer Module
Check change notes. Vanilla Furniture Expanded – Spacer 2 is a major overhaul of the original Spacer module, designed to bring your late-game colonies into the futuristic era with furniture that actually looks and feels futuristic. This update modernizes all visuals, rebalances g


Vanilla Furniture Expanded - Security
Check change notes. Vanilla Furniture Expanded - Security is a complete overhaul and rebalance of the original security module, addressing outdated balance and vastly expanding defensive options from early to late game. For the new players, this mod should be the ultimate thing y
More Mods by Yayoiiiiiiiii

SmartGenerator
SmartGenerator — 燃料发电机自动电量管理 **功能** - 根据电网电池储电量比例自动开关燃料发电机:电量低于低阈值时自动开机,高于高阈值时自动关机。高低阈值之间保持至少 10% 回差,避免频繁启停。 - 每台发电机可单独设置低阈值与高阈值。多台发电机可通过设置不同阈值区间,自然形成启停的先后顺序。 - 对带有燃料仓的发电机,燃料耗尽时自动管理暂停,补充燃料后自动恢复。 - 兼容 RimFeller 等管道燃料发电机(燃料从储罐直接消耗,无燃料仓)。 - 玩家手动关闭发电机后,自动管理跟随暂停;手动开启后自动恢复。自动管理不会覆盖手动操作
Days of Food
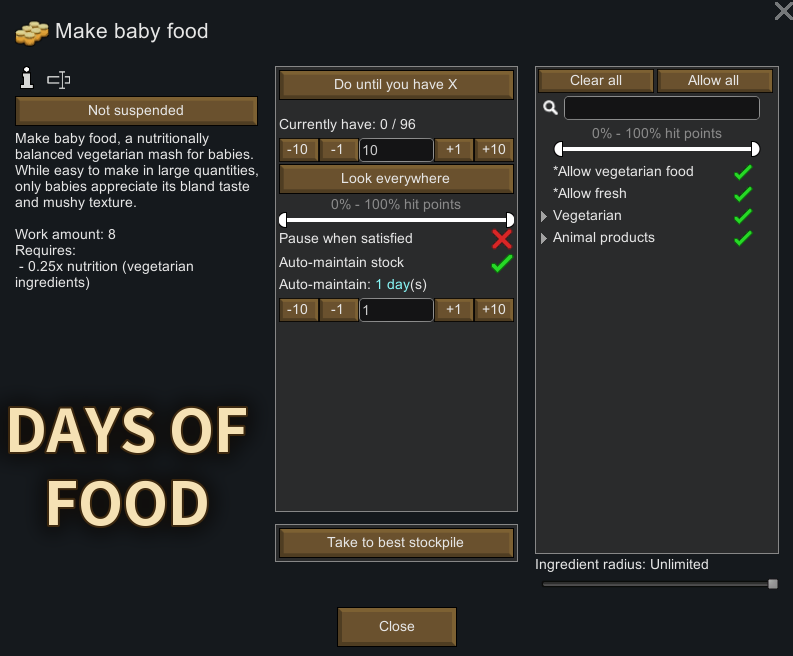
Days of Food —— 按"天数"自动维持食物产量 在账单详情窗口"数量达到时暂停"下方会多出一个 "自动维持数量" 开关。勾上它,填个天数(任意正整数,比如 5),模组就会按殖民地当前的实际吃饭人口自动算出该维持的食物数量,并且每天自动更新一次。人多了自动加量,人少了自动减量,你只需要保证厨师和食材到位。还可以叠加 "到量暂停":设维持 5 天、直到 2 天,库存达到 5 天量就暂停生产,跌破 2 天量再自动恢复。 它是怎么算的 目标数量 = 本地图全体进食者的每日总营养需求 × 天数 ÷ 单份食物的营养值。 统计范围是自由殖民者(含奴隶)和我
More Management Mods

Vanilla Apparel Expanded
1.2.1 (25/02/2020): Formal wear now counts as royal apparel. 1.2.0 (19/02/2020): This mod is now 1.1 compatible. After a hundred hours playing RimWorld you notice that every pawn wears somewhat the same things. The base game apparel is not really as interesting, unique and variou

Vanilla Fishing Expanded
Vanilla Fishing Expanded is a first module in a brand new mod series “Vanilla Cuisine Expanded” from the Vanilla Expanded team.

Vanilla Events Expanded
See changenotes. Vanilla Events Expanded is one of our oldest mods, and I’m honestly shocked it’s holding up so well - it’s pretty resistant to game updates and bugs because of its simplicity. Back when I first made it with Kikohi, we didn’t know much about modding. I just wanted